

Darwin Harbour Report Card 2016
Data Summary Zone 1: Elizabeth River
For report card grades the median of the data (solid line in the box) is compared to the Water Quality Objective (dotted line) for each parameter.
The distribution of the data for all parameters is shown here as box and whisker plots.
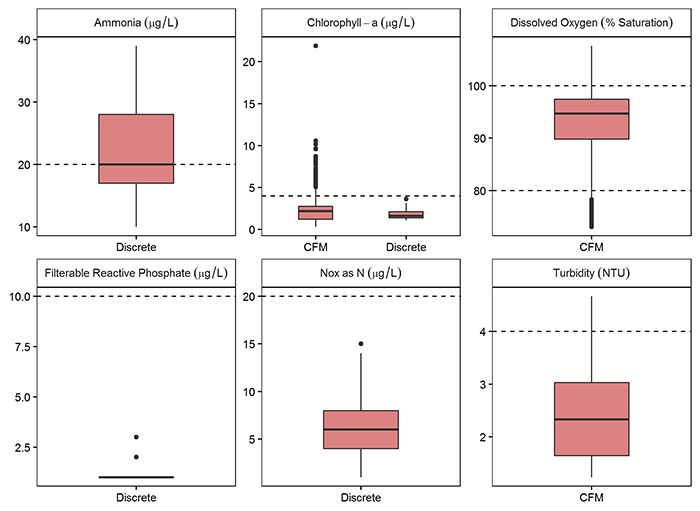
(CFM: data from continuous flow cell monitoring, Discrete: data from spot samples)
Give feedback about this page.
Share this page:
URL copied!