

Darwin Harbour water quality report 2020
Water quality monitoring in Darwin Harbour
Every year the Darwin Harbour water quality report assesses the water quality of Darwin Harbour against the Darwin Harbour water quality objectives.
Water quality data were collected by the Aquatic Group of the Department of Environment, Parks and water Security and supplemented by monitoring data from Power and Water Corporation and Santos in 2020.
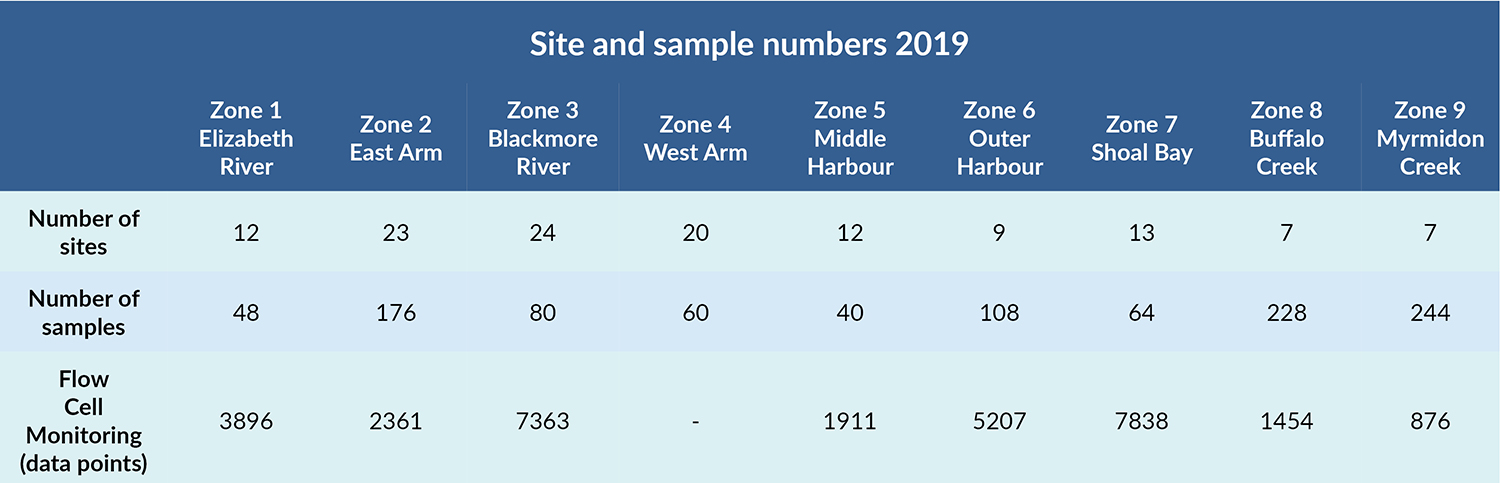
Nine reporting zones represent different physical environments in the harbour, which feature marine biota such as seagrass beds, coral reefs and fringing mangroves.
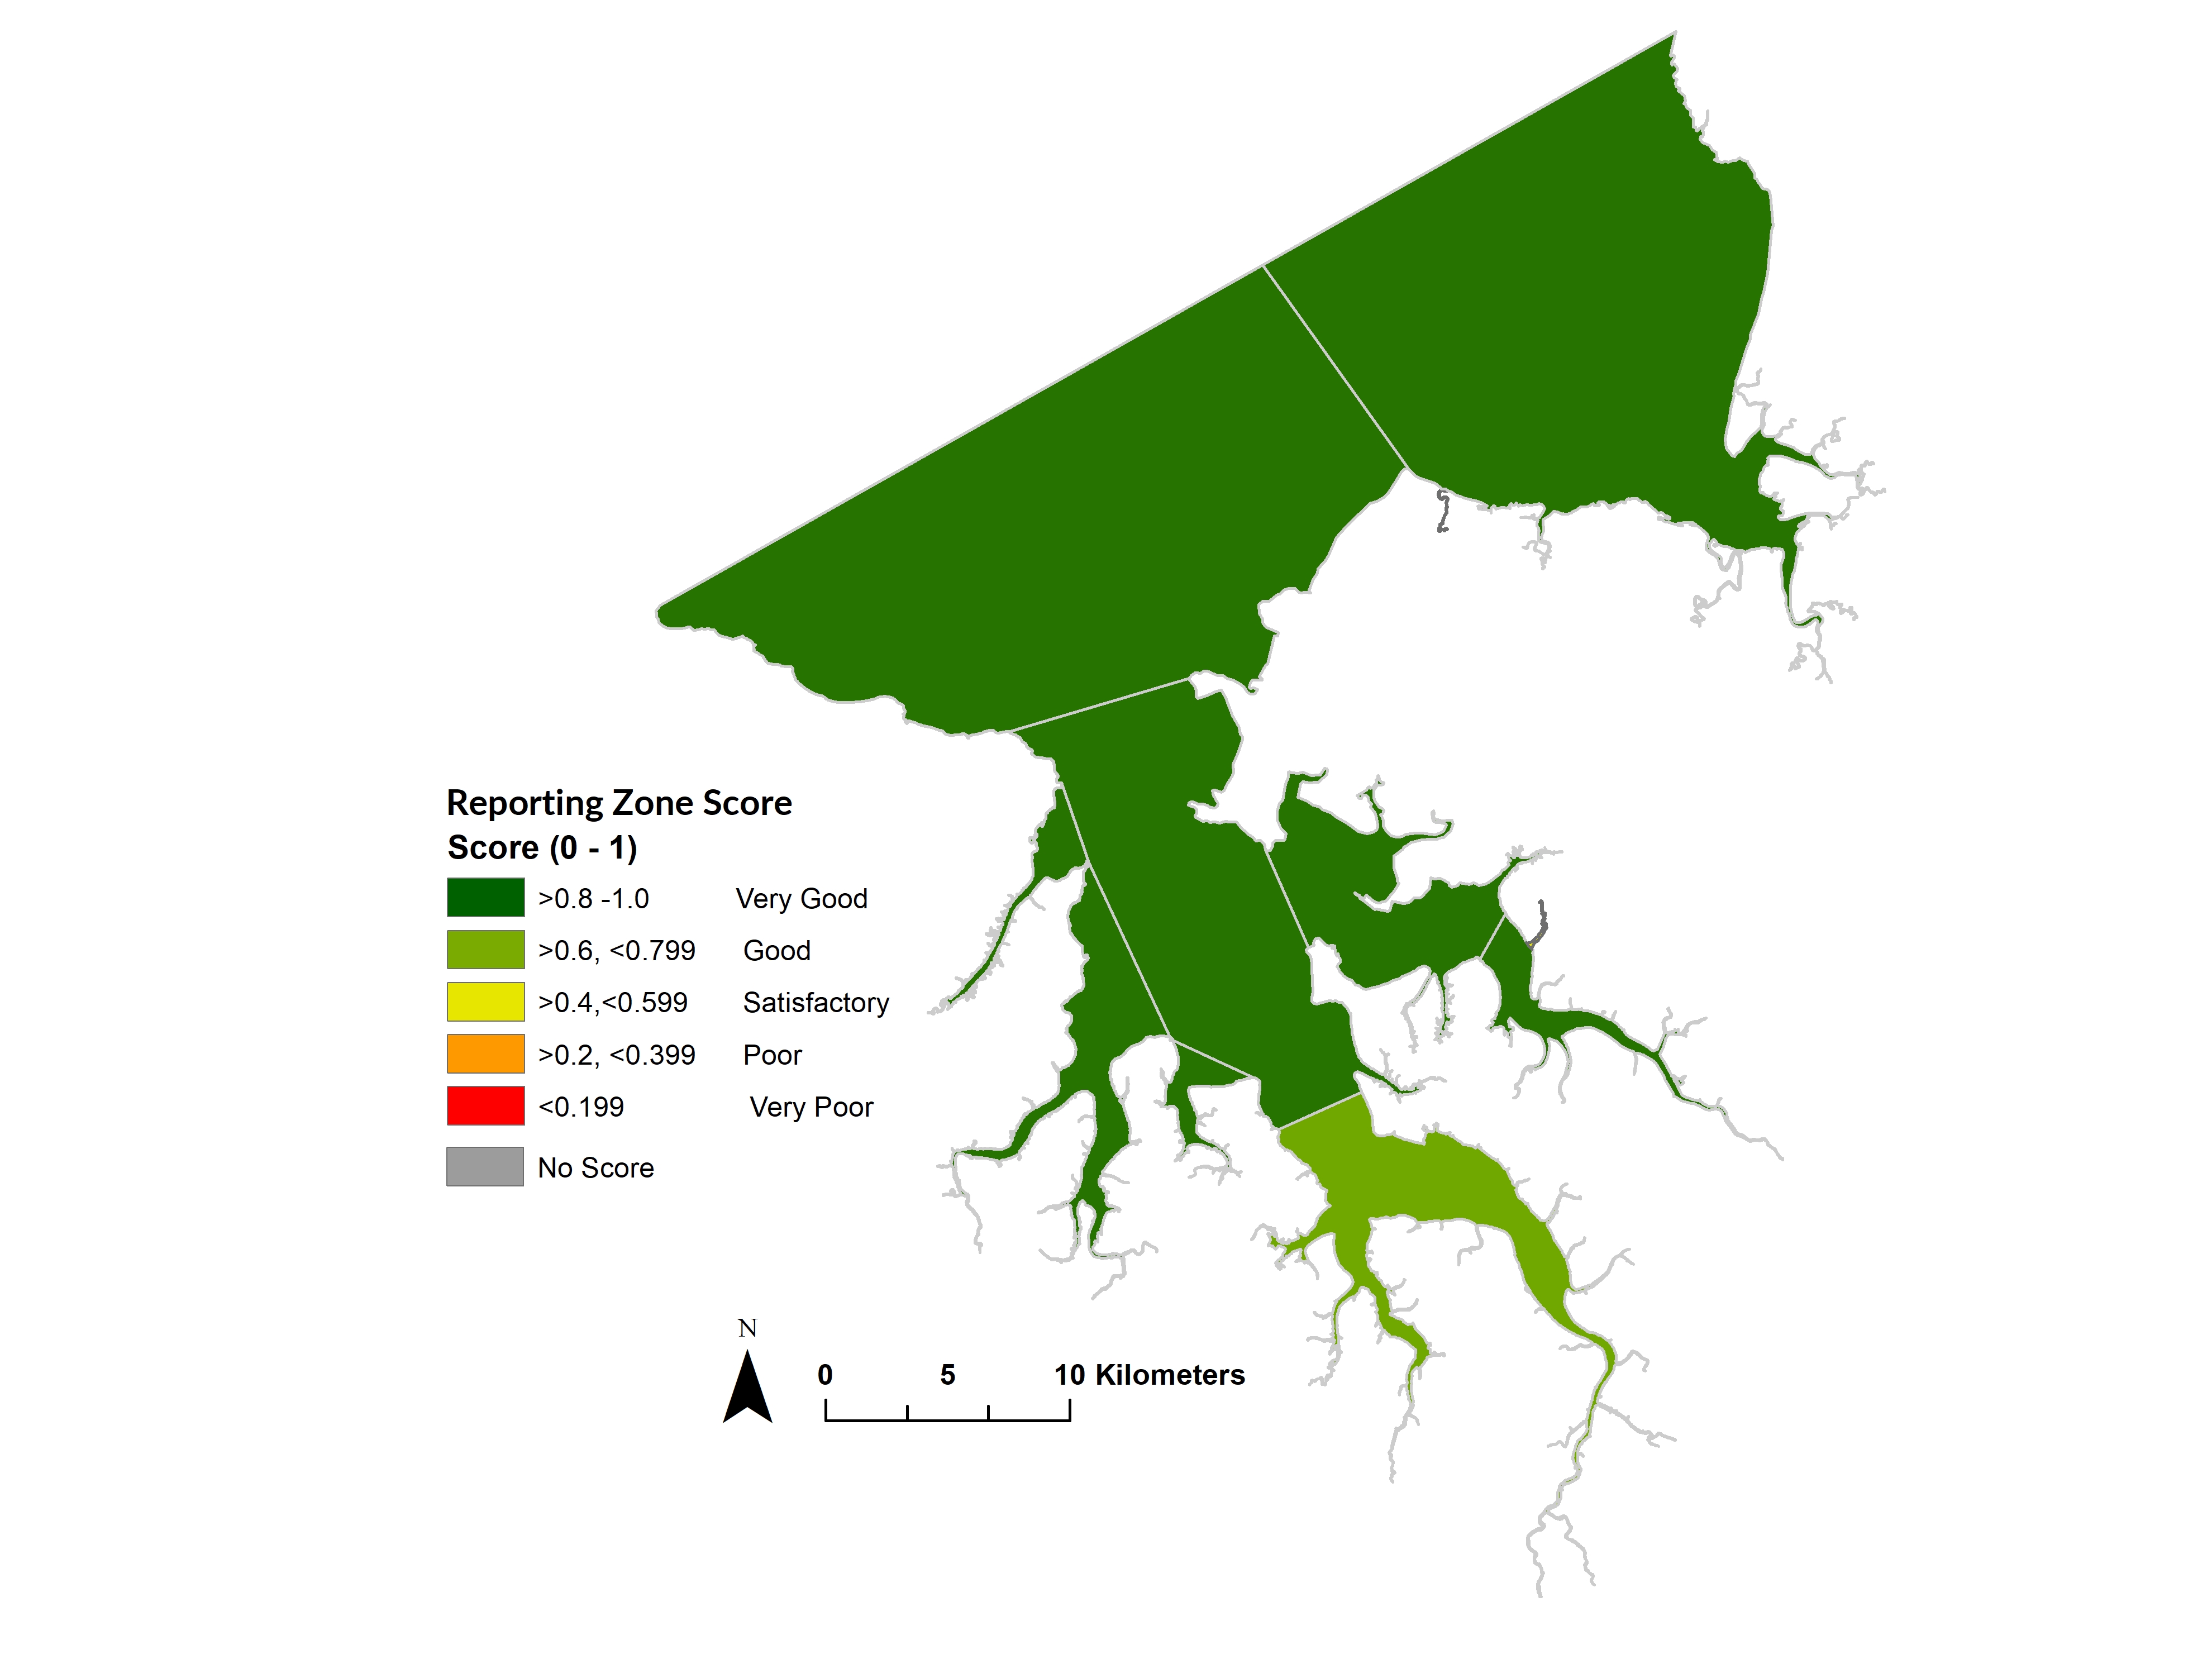
The Harbour's water quality was largely graded very good in 2020. An exception was Buffalo Creek estuary, which was impacted mainly by wastewater discharge from the Leanyer-Sanderson sewage treatment plant.
No marine pests were detected in 2020 and the beaches were suitable for swimming throughout the dry season.
2020 overview
2020 Water quality report at a glance PDF (4.8 MB)

What’s new!
To support the new integrated reporting framework for the health of Darwin Harbour a ‘Water Quality Index’ has been developed by the Department of Environment, Parks and Water Security (DEPWS) with assistance from Australian Institute of Marine Science.
Water Quality Index (WQI) is a single number which can be calculated easily and used to provide an overall description of the quality of water. It provides a methodology to summarise the quality of water using a single value and a corresponding scale.
See the Water Quality Index section below for more information.
Water Quality Index
Overall water quality index

Station data
Data reflects annual mean value for site indicators.
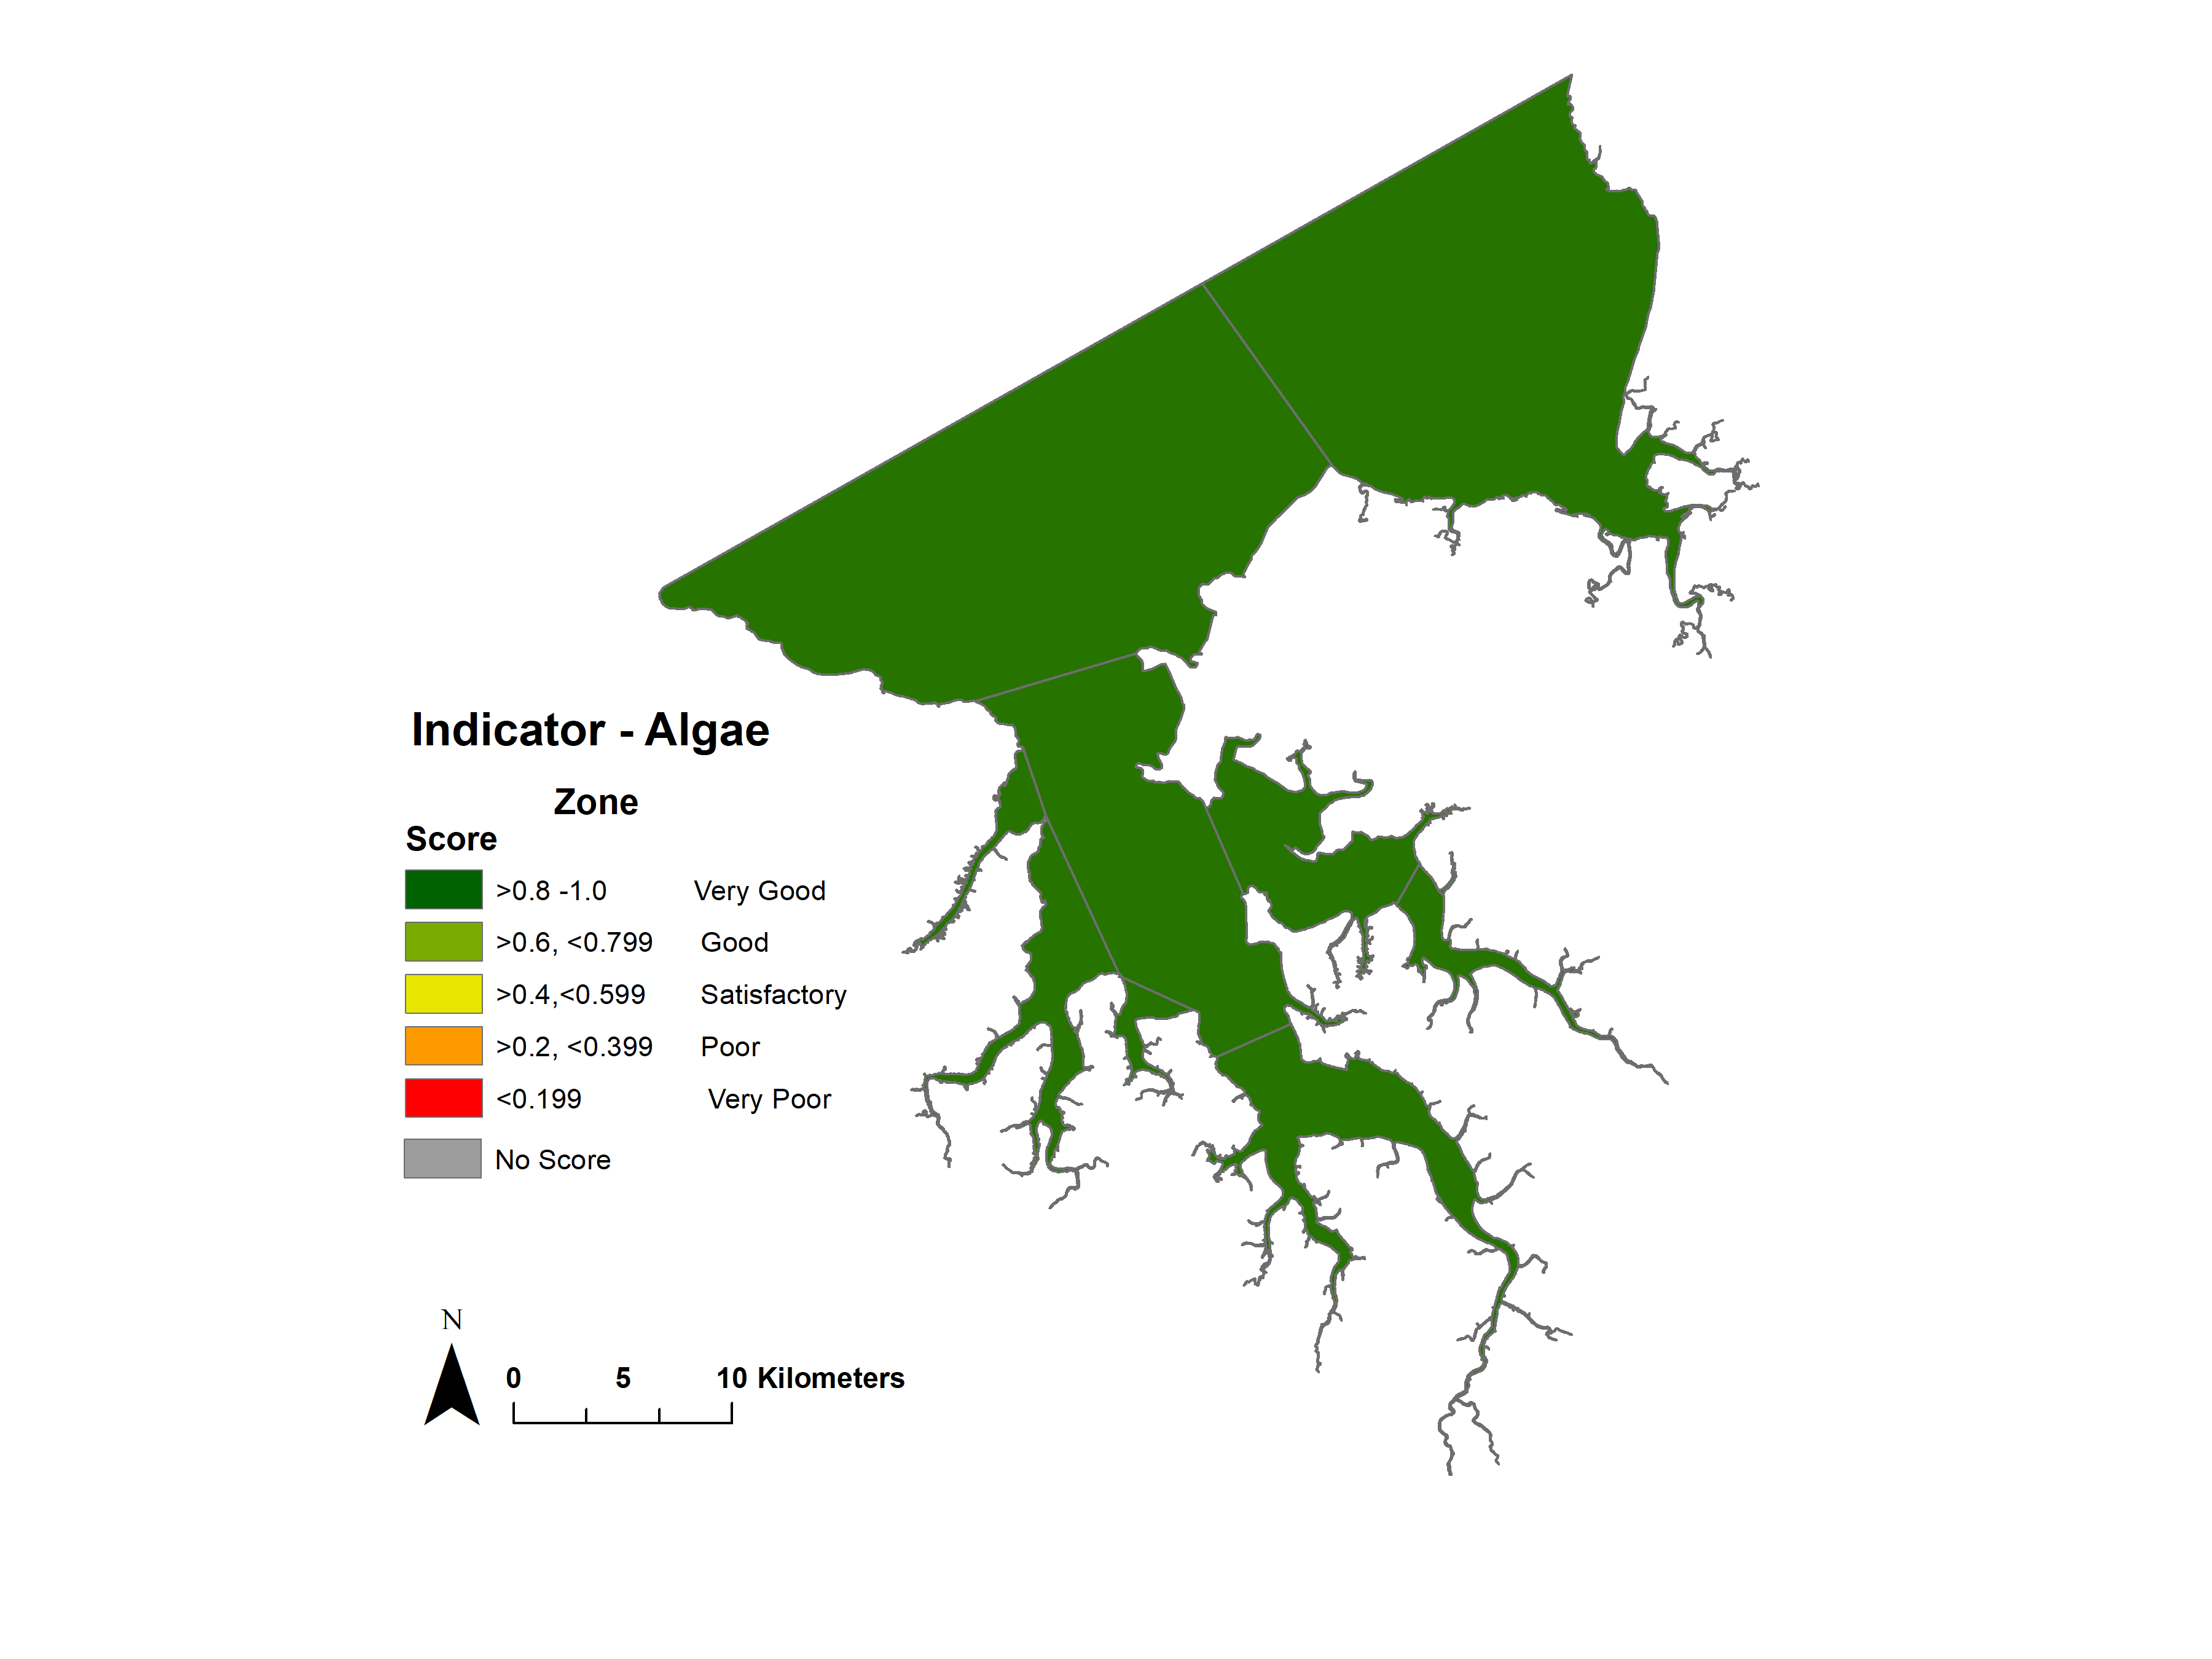
Indicator - Algae
| Indicator | Map |
|---|---|
|
|

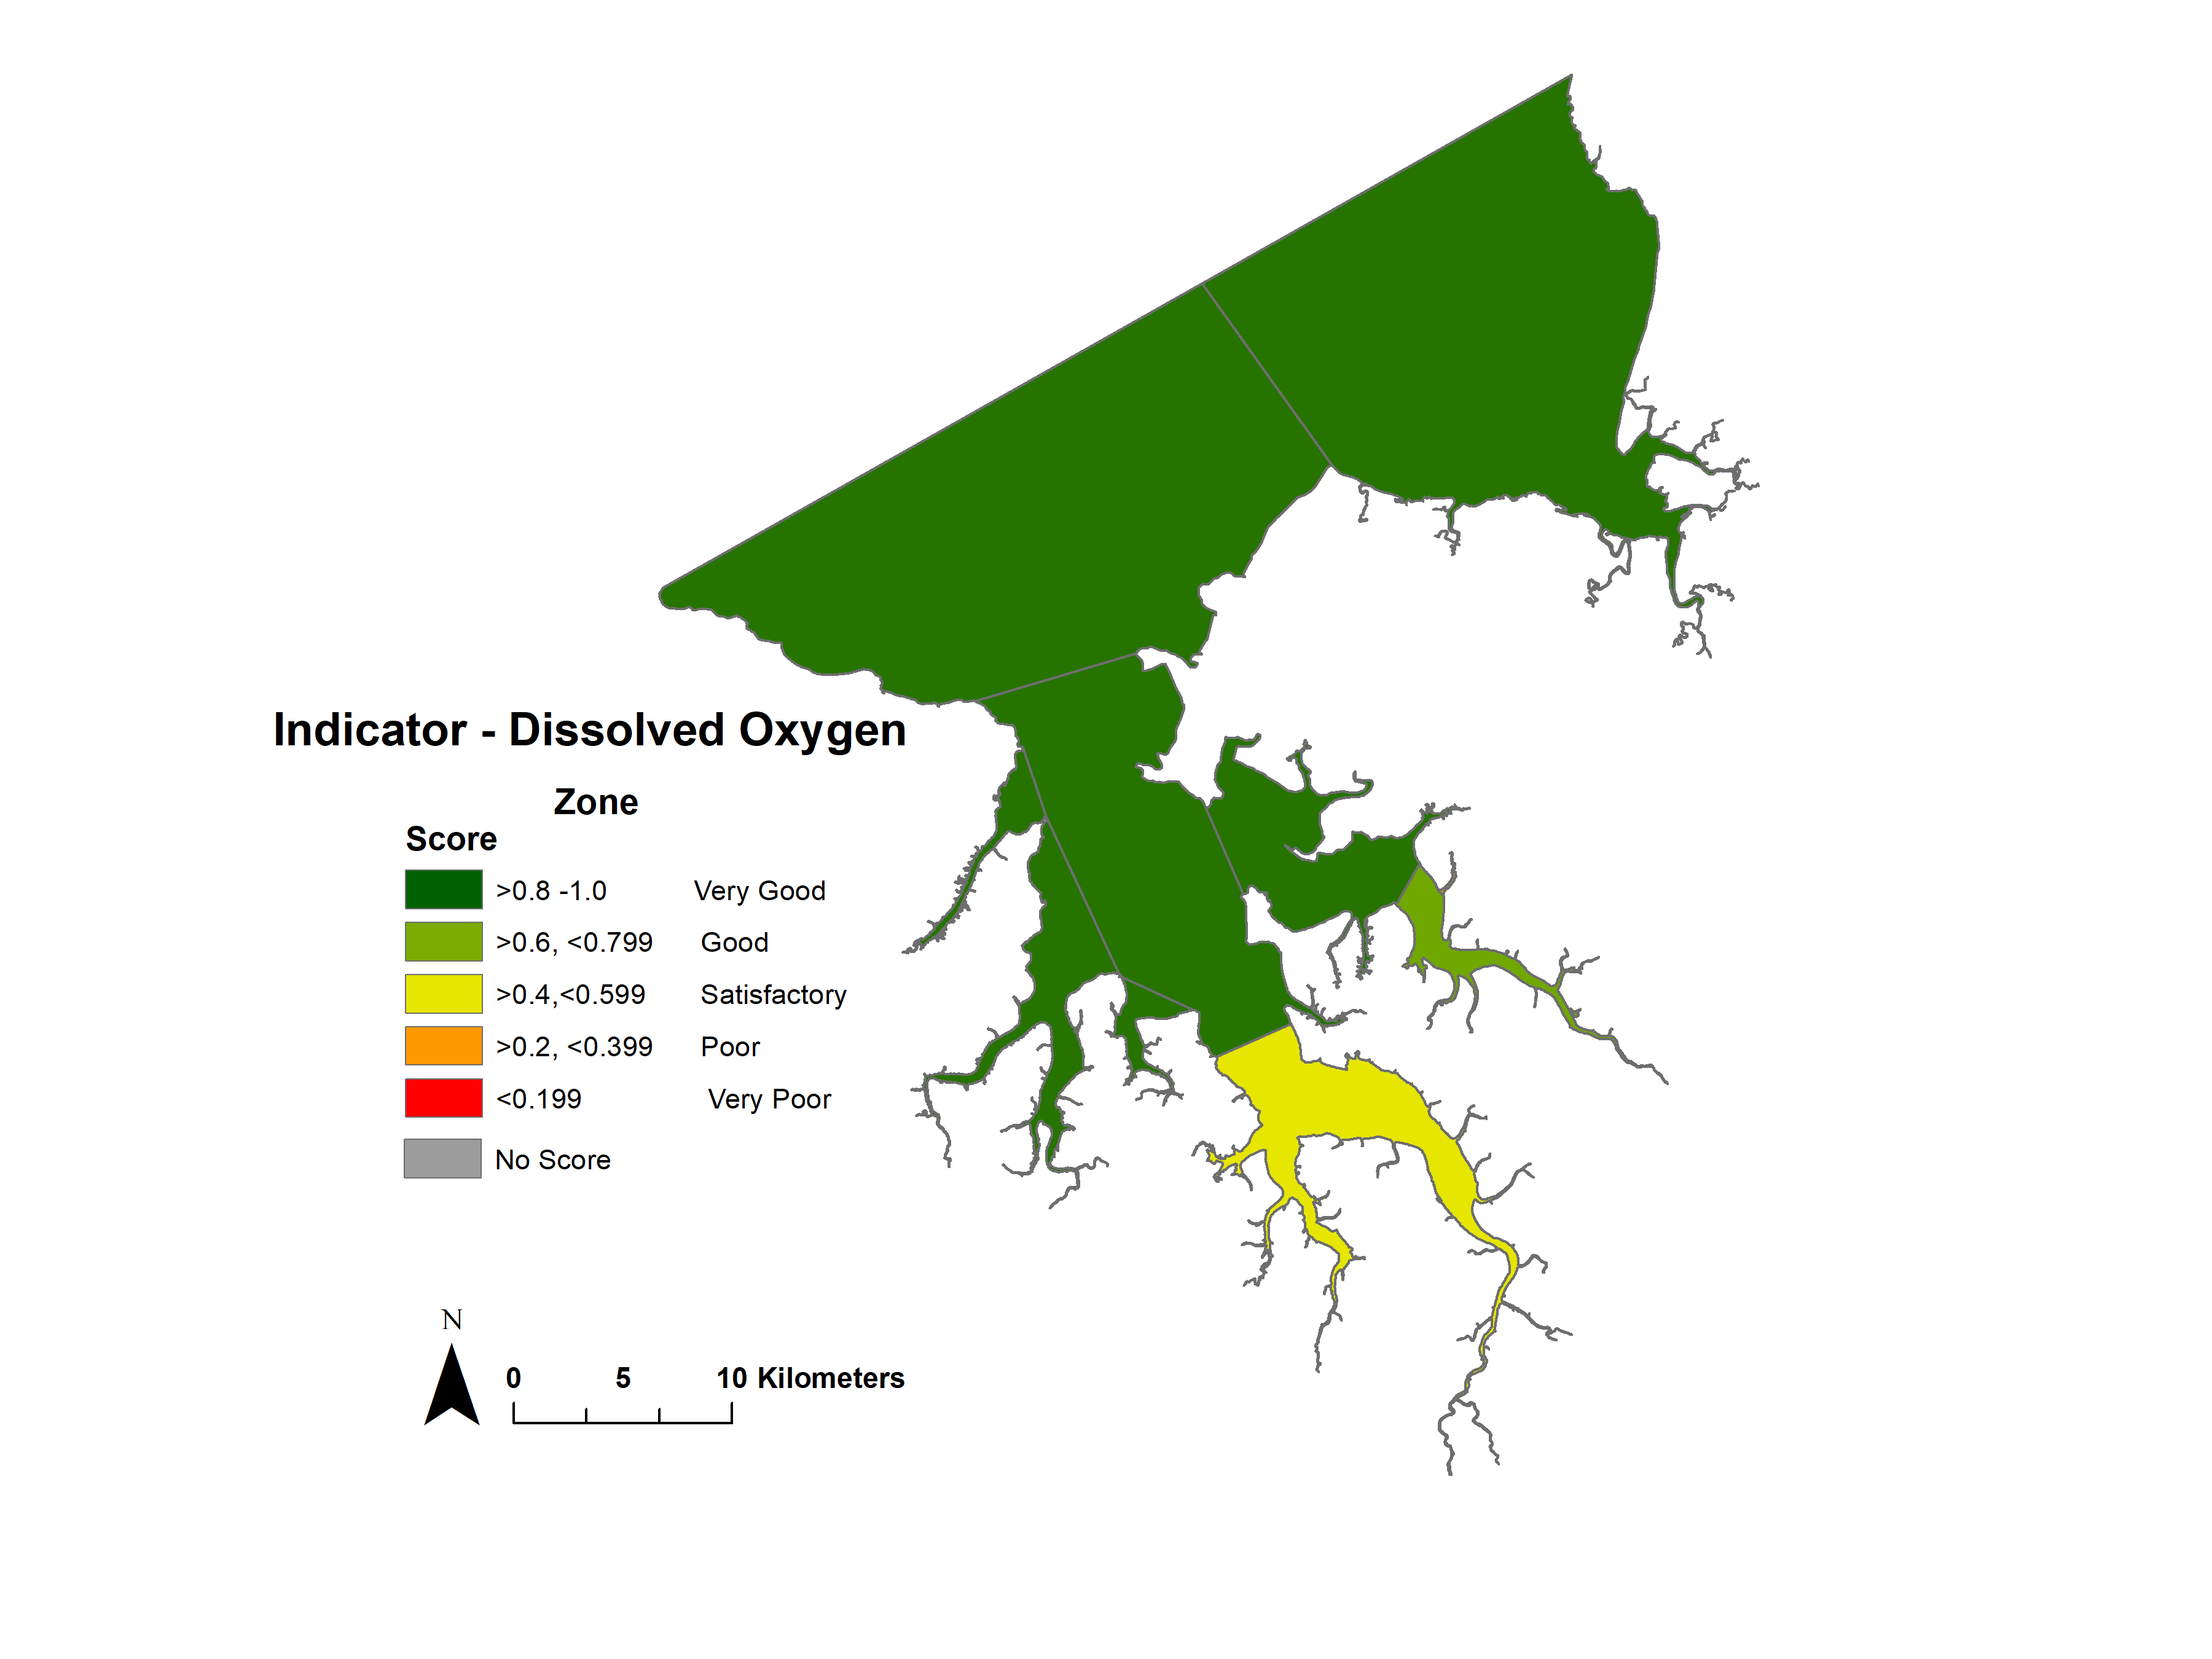
Indicator - Dissolved Oxygen
| Indicator | Map |
|---|---|
|  |
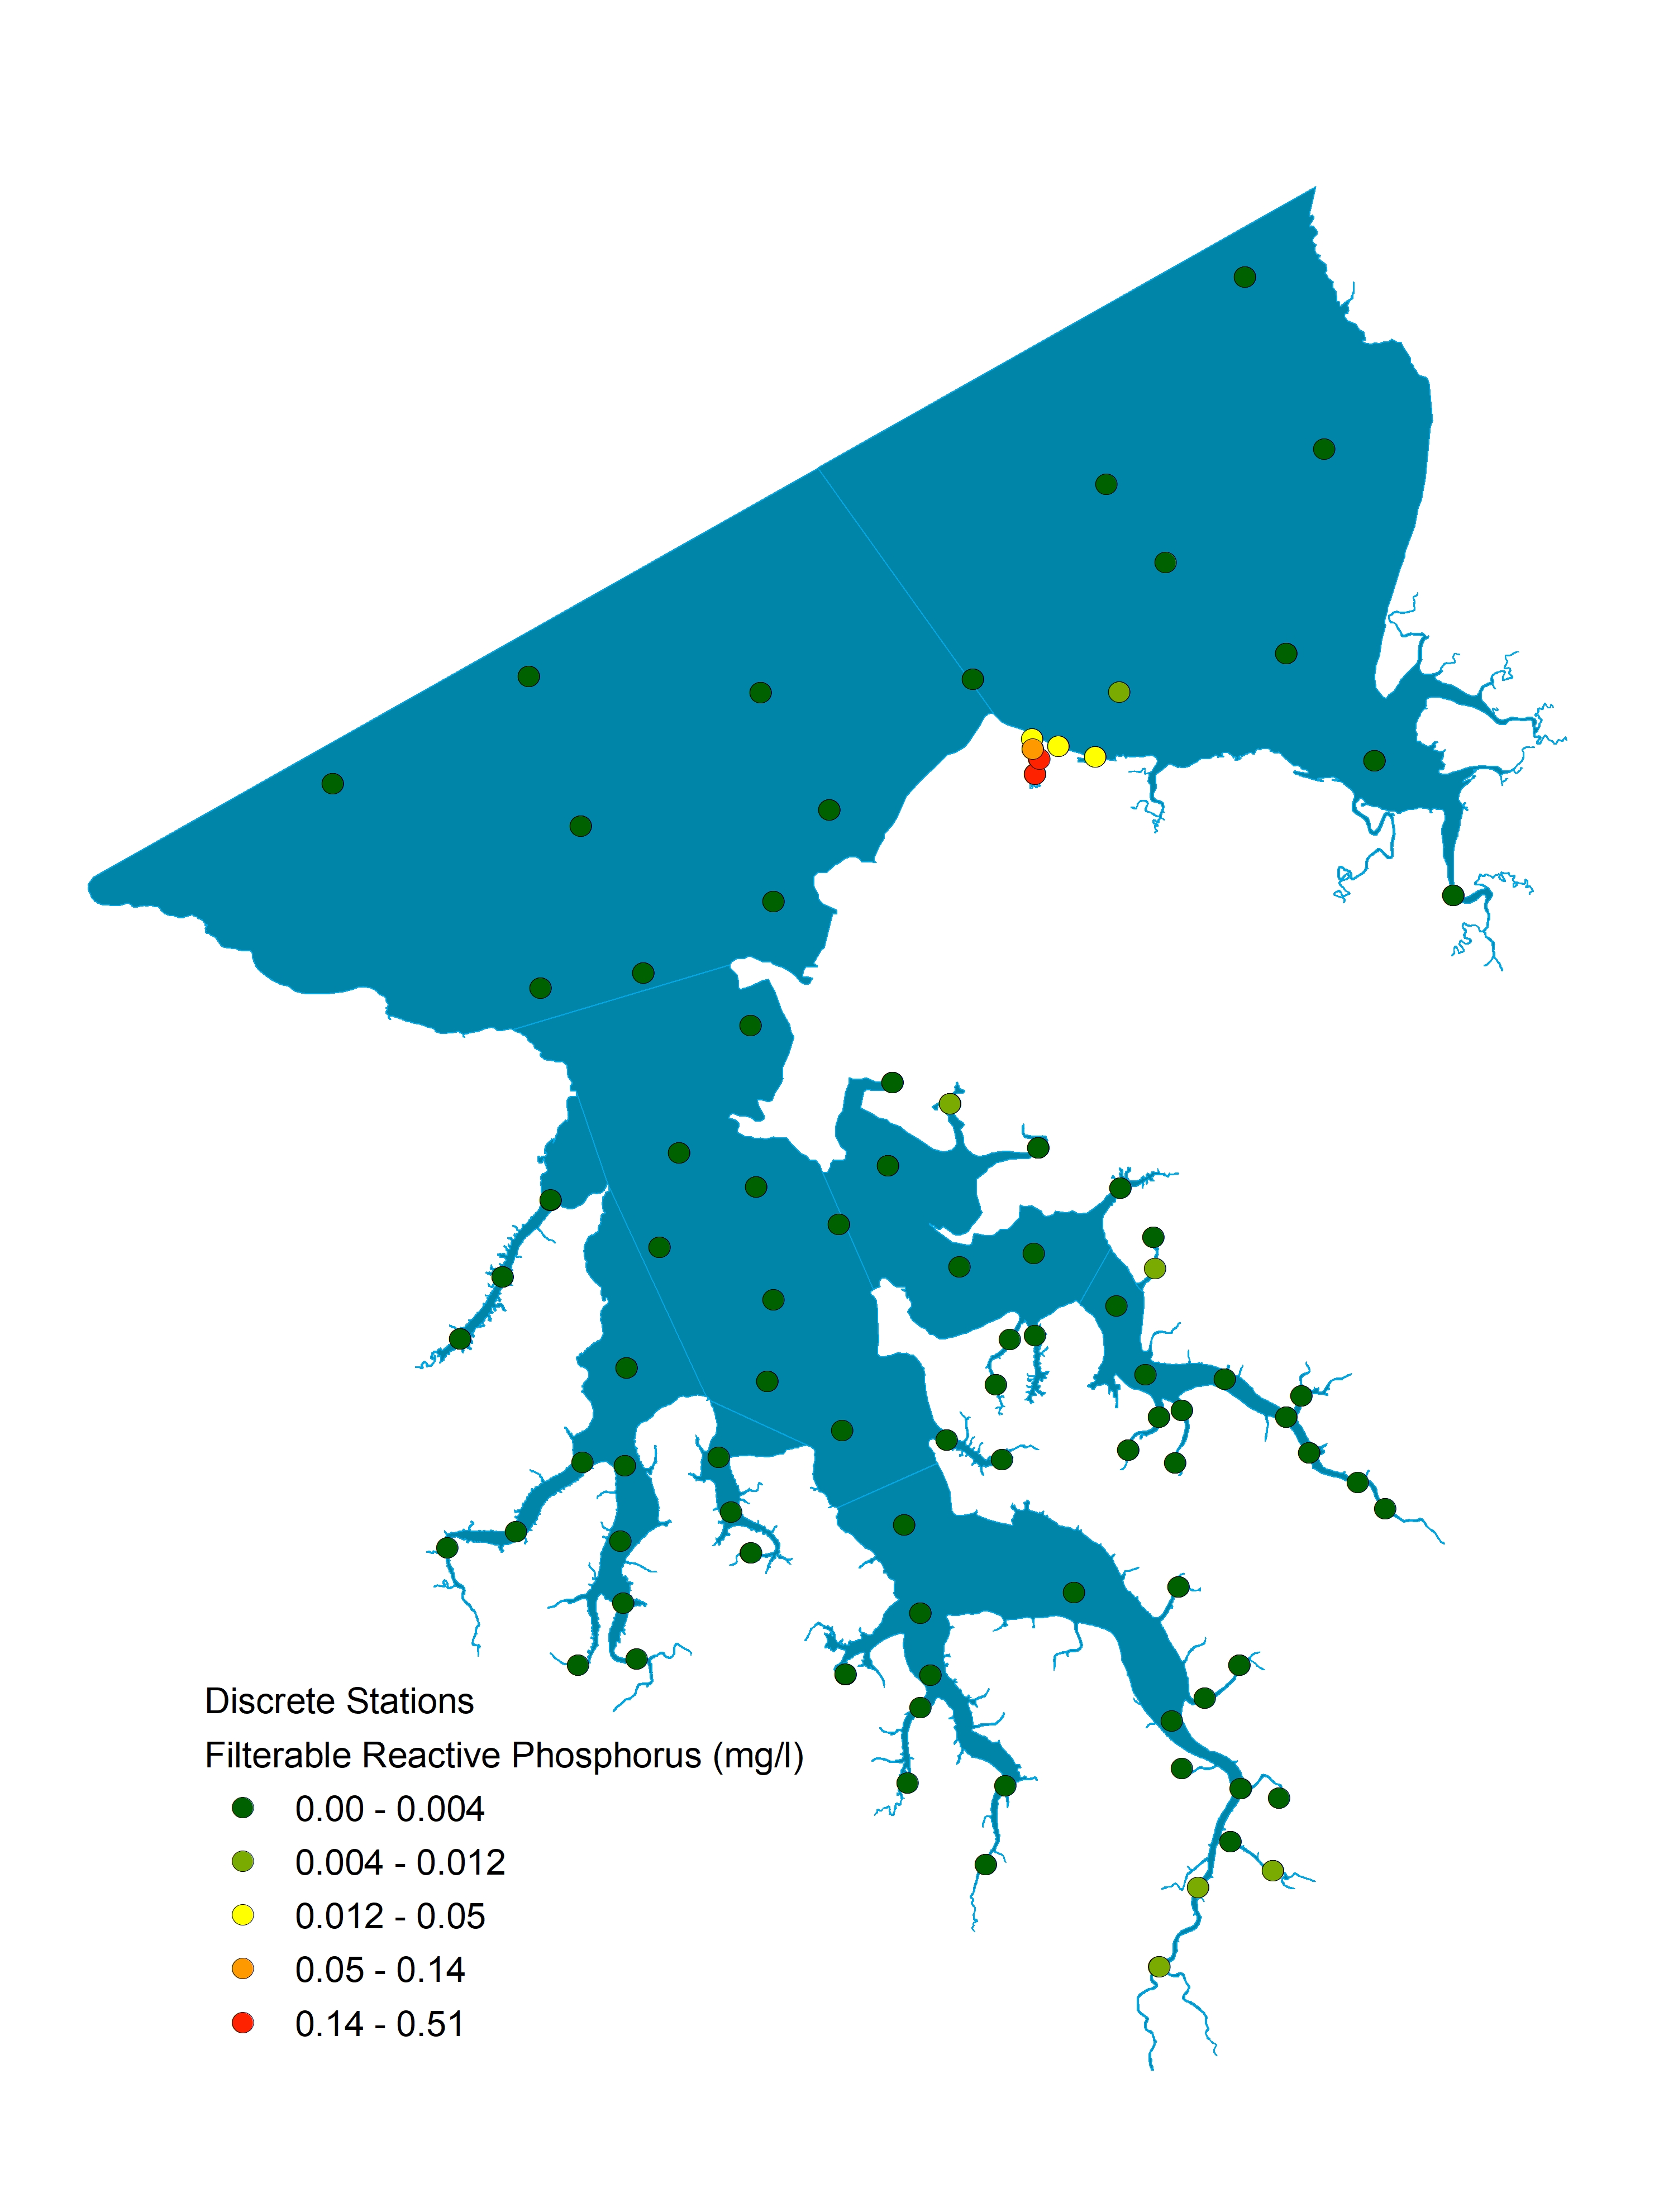
Indicator - Nutrients
| Indicator | Map |
|---|---|
|
|


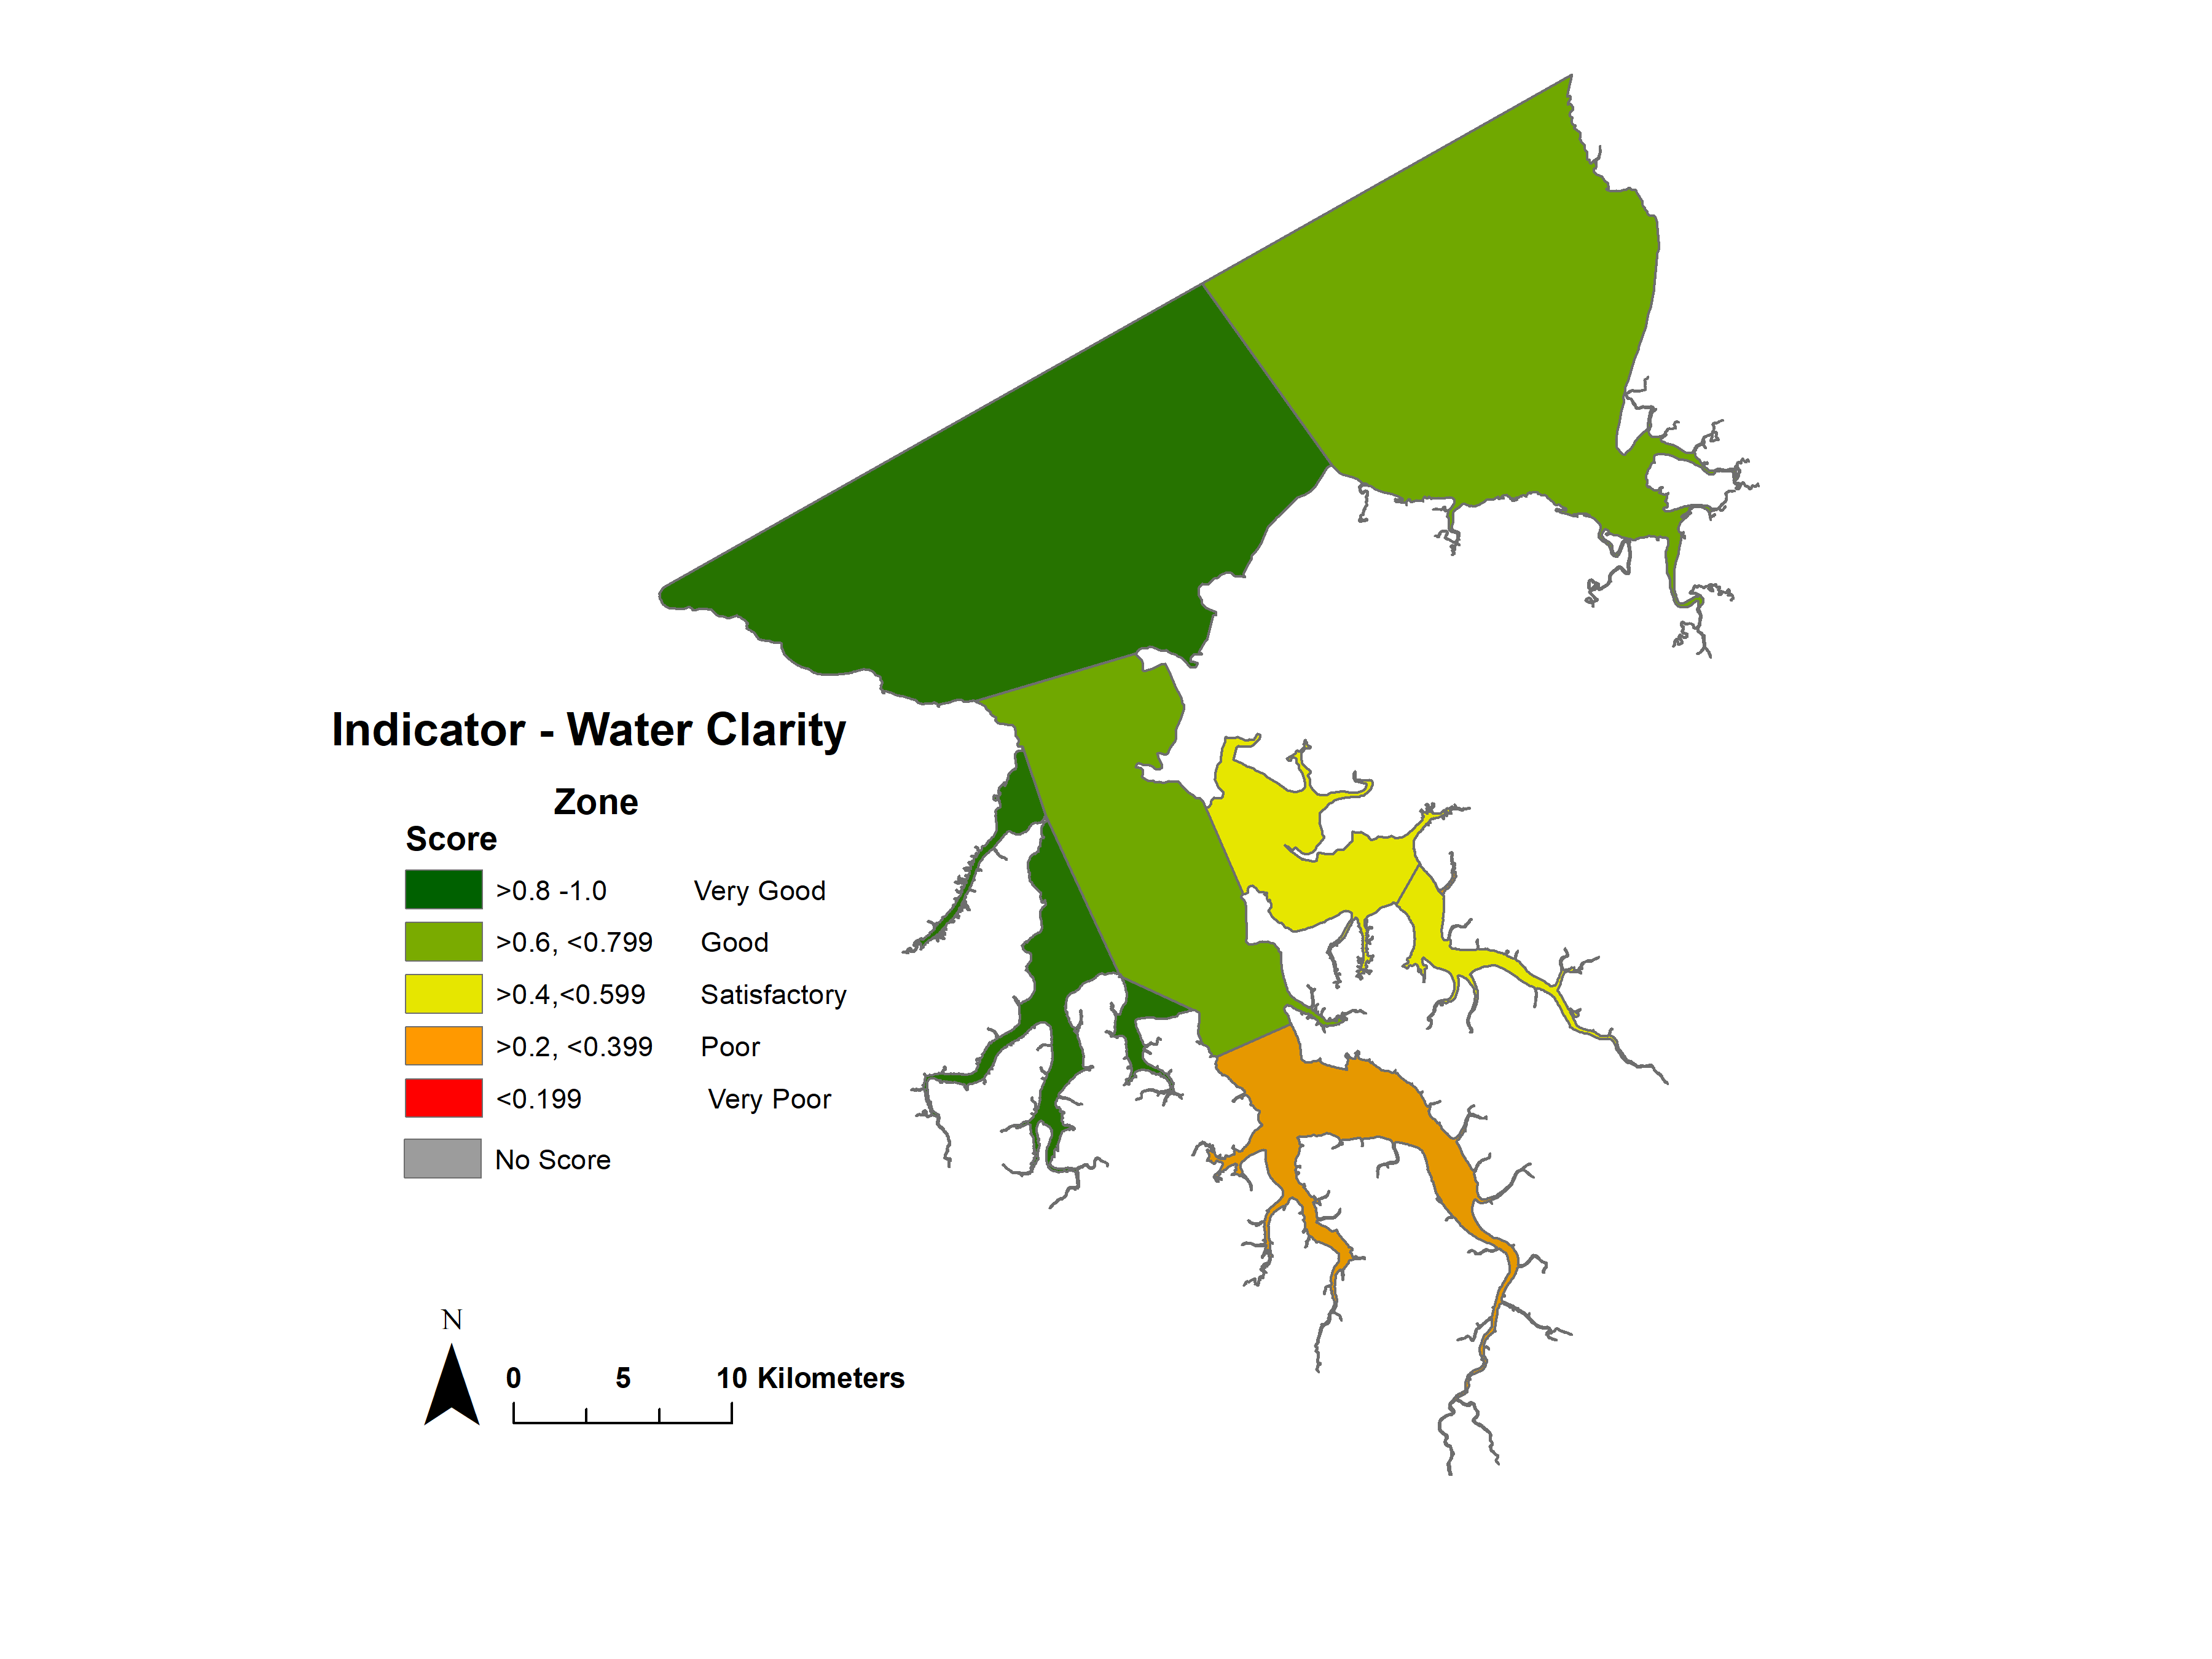
Indicator - Water Clarity
| Indicator | Map |
|---|---|
|
|

Data collection and calculation
How grades are calculated
New to the 2020 report!
Transitioning to a Water Quality Index - WQI
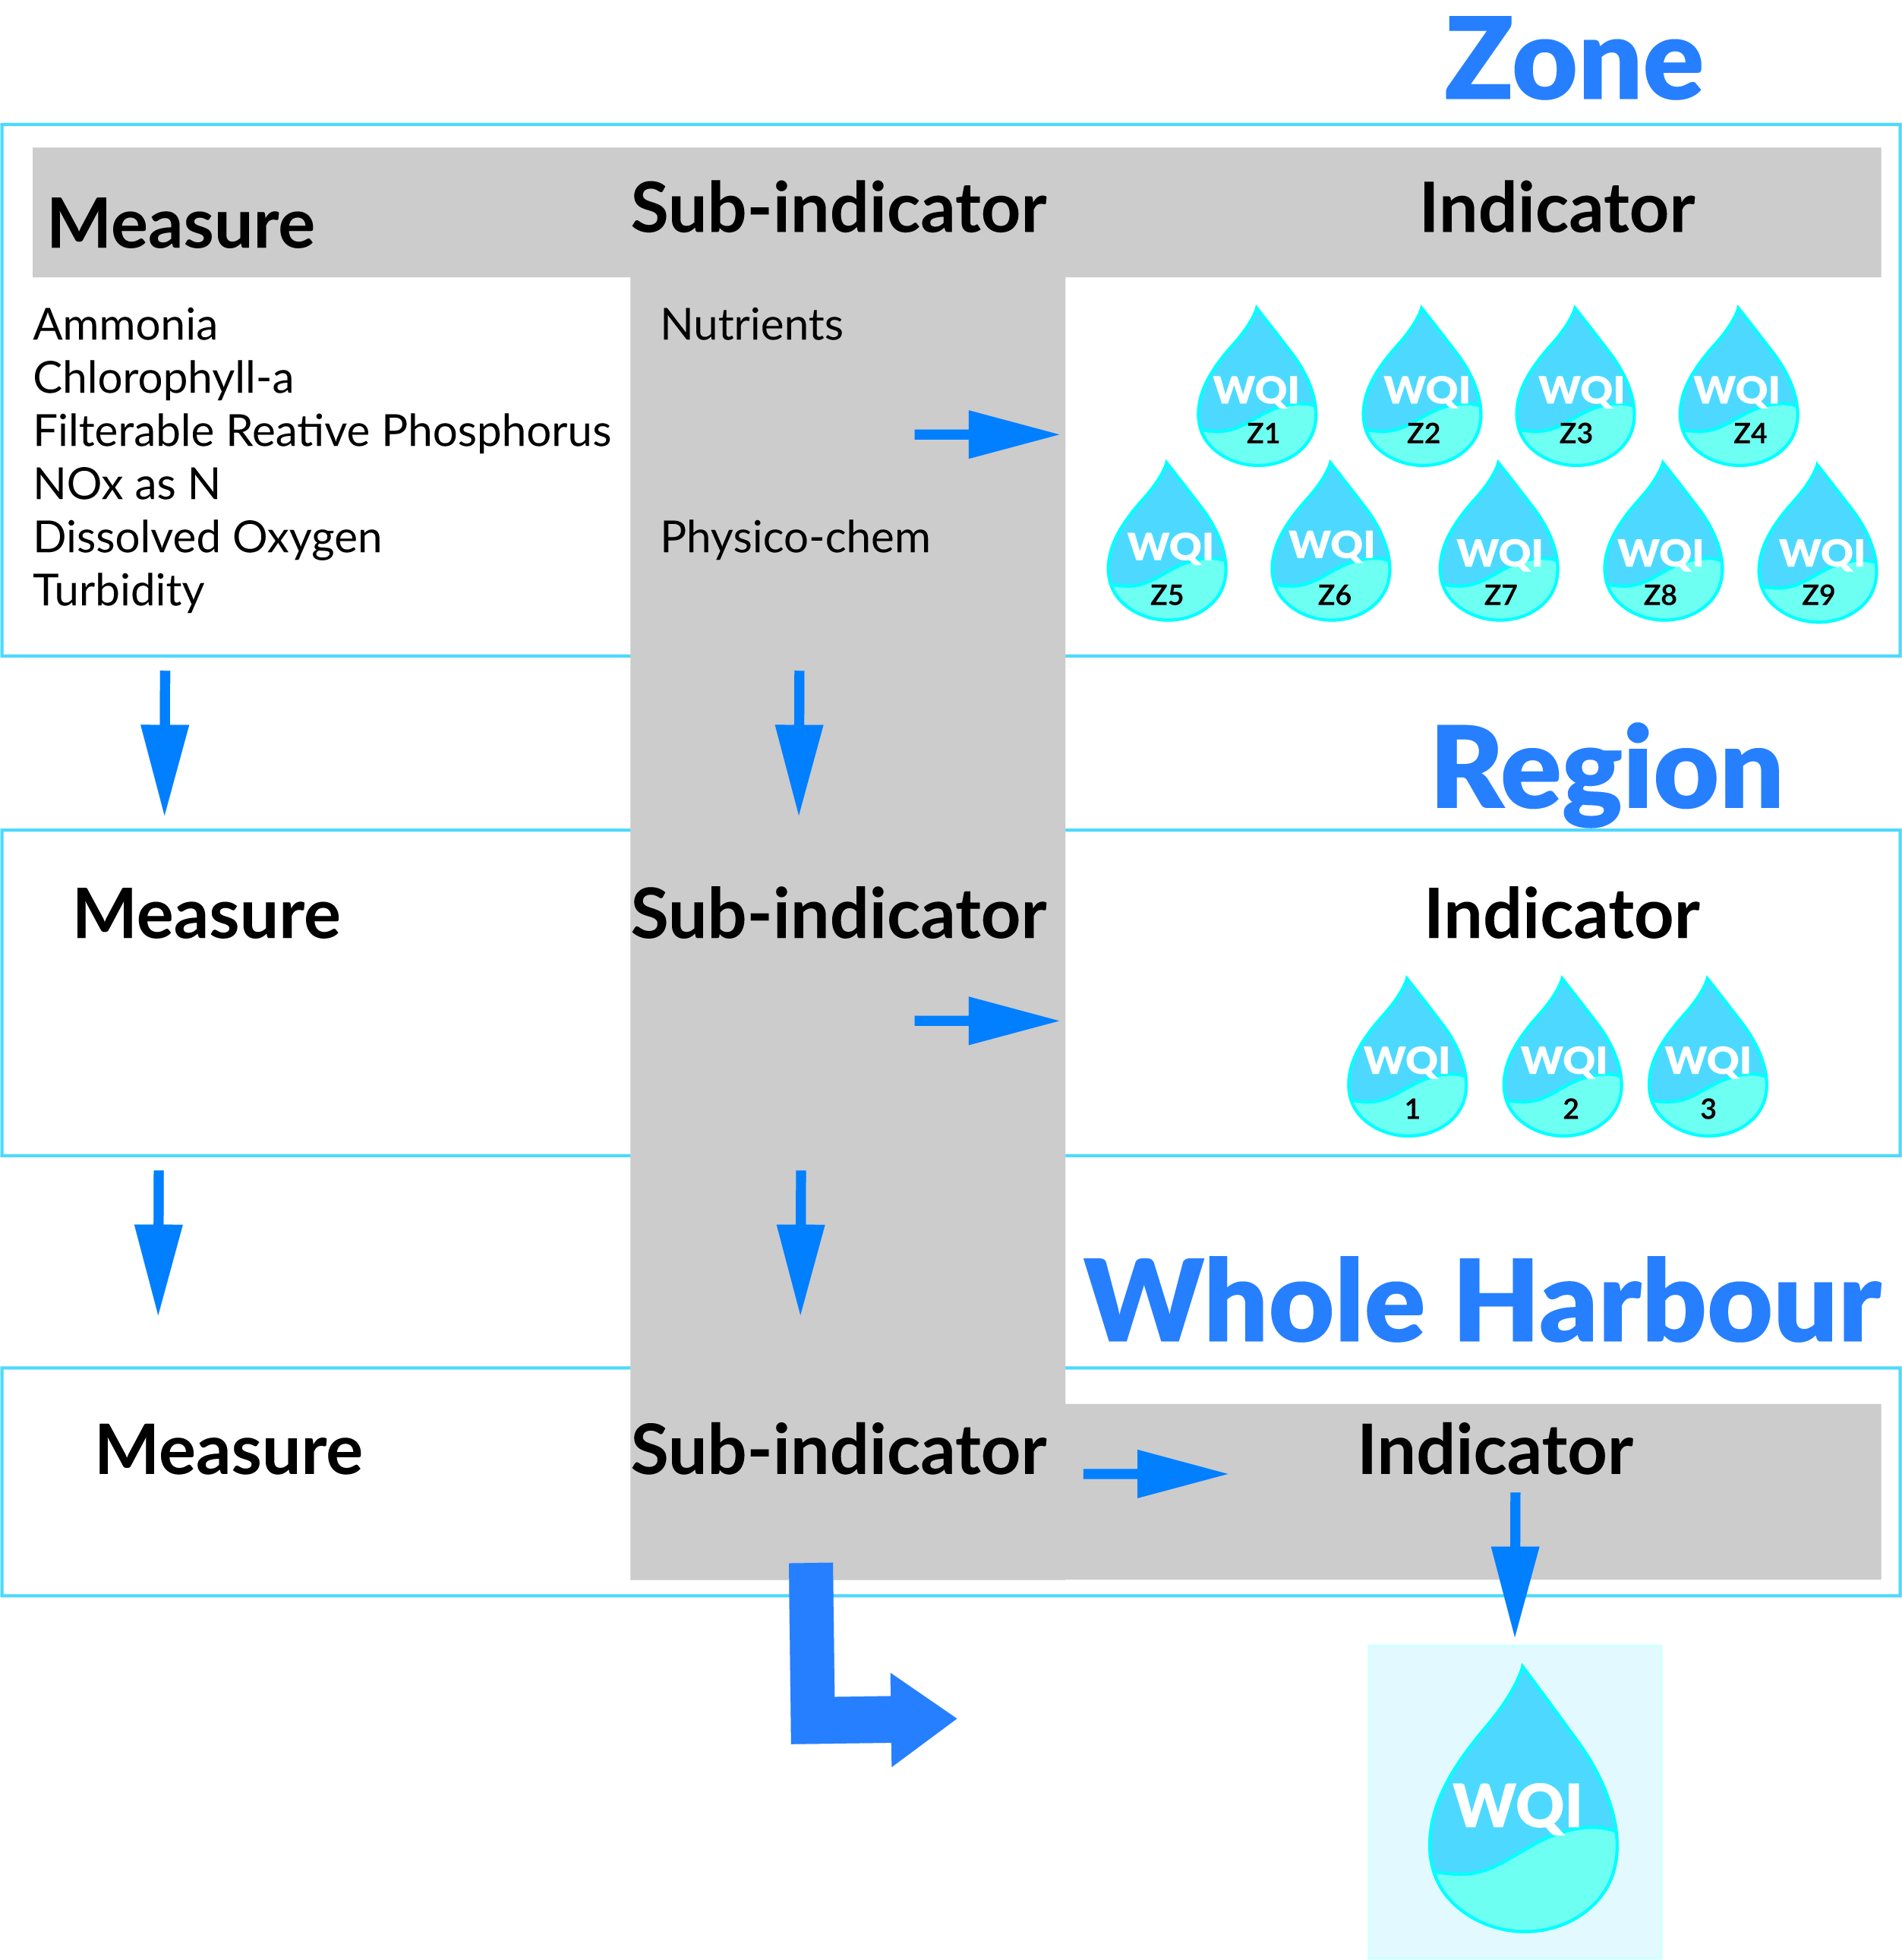
All water quality data is aggregated using a methodology that generates a WQI which can be calculated easily and used to provide an overall description of the quality of water. It provides an approach to summarise water quality using a single value and a corresponding scale.
Each measured value at each location (either fixed sites or positions along Continuous Flow Monitoring transects) is compared to a guideline value (specific to that measure and sampling Zone) to yield an index value that expresses the difference between the observed value and the guideline on a standardized scale of 0 to 1 via a process called fixed cap scaled modified amplitude (Logan, 2016).
(Adapted from: Logan, 2016)
The scores at each reporting level (measures, sub-indicators, indicators, zones, regions and whole of harbour) are thereafter calculated as the mean of the data aggregated at each of those levels and these scores are further expressed as grades according to a simple classification of A: Very good (greater than or equal to 0.80), B: Good (greater than or equal to 0.6, less than 0.8), C: Satisfactory (greater than or equal to 0.4, less than 0.60), D: Poor (greater than or equal to 0.2, less than 0.4) and E: Very Poor (less than or equal to 0.2).
Data used to inform the index will be drawn from the DEPWS marine water quality monitoring program and other stakeholder data.
How data are collected and grades calculated
| Grade | Water quality rating | WQI | Equivalent (%) |
|---|---|---|---|
| A | Very Good | >0.8 - 1.0 | 80-100% |
| B | Good | >0.6, <0.79 | 60-80% |
| C | Satisfactory | >0.4, <0.59 | 40-60% |
| D | Poor | >0.2, <0.39 | 20-40% |
| E | Very Poor | <0.2 | <20% |
In some exceptional circumstances, expert opinion may override the calculated water quality grade.
This may occur because data collection in a particular year was affected by unusual circumstance, or because a very slight exceedance of the water quality objectives for a particular indicator is deemed to be of no ecological consequence.
Reference: Logan, M (2016). Pilot 1 - Upgrade of Darwin Harbour Report Card Analytics. Report prepared by the Australian Institute of Marine Science for Aquatic Health Unit, Water Resources Division, Department of Land Resources Management.
Report data collection
Water quality data for the Darwin Harbour report cards were collected during the dry season. Data collection was restricted to neap tides to minimise variability due to tidal influence.
Surface water quality (pH, dissolved oxygen, salinity, temperature and turbidity) was measured at one-second intervals along continuous transects across the nine reporting zones, using a flow-cell method that continuously pumps water through a water quality instrument. More than 100,000 measurements were made in 2020 using this method.
Water samples were also collected from over 100 sites and analysed for nutrients and chlorophyll-a.
Water quality indicators
Four key water quality indicators are assessed for the Darwin Harbour.
| Icon | Indicator | Parameter | Why is this important? |
|---|---|---|---|
 | Water clarity | Turbidity | Light is important for microscopic algae and other plants, such as seagrasses, to grow and photosynthesize. Stormwater and dredging can reduce water clarity and affect plant growth. |
 | Dissolved oxygen | Oxygen saturation | Oxygen dissolved in the water is essential for fish and other animals to survive. The amount of oxygen in the water can be reduced by water pollution. |
 | Nutrients | Nitrogen oxide, ammonia and soluble phosphorus concentrations | Nitrogen and phosphorus are nutrients required for algae to grow. However, high nutrient concentrations can increase the amount of algae, resulting in algal blooms which affect the broader environment. |
 | Algae | Chlorophyll-a concentration | These are microscopic plants that may appear as specks in the water, or as a scum floating on the surface. Algae are an important part of the ecosystem in the harbour, but excessive amounts have a detrimental effect on the waterway. |
Water quality objectives
The Darwin Harbour Water Quality Objectives provide locally derived guideline values for water quality indicators in Darwin Harbour.
*Water quality guideline value (WQGV)
| Indicators | Sub-indicators | WQGV Upper estuary | WQGV Mid estuary | WQGV Outer estuary |
|---|---|---|---|---|
| Dissolved Oxygen | Dissolved oxygen (% saturation) | 80 to 100 | 80 to 100 | 80 to 100 |
| Water clarity | Turbidity (NTU) | <4 | <4 | <4 |
| Algae | Chlorophyll-a (µg/L) | <4 | <2 | <1 |
| Nutrients | NOx_N (µg/L) | <20 | <20 | <10 |
| Ammonia as N (µg/L) | <20 | <20 | <20 | |
| Filterable Reactive Phosphorus (µg/L) | <10 | <5 | <10 |
Give feedback about this page.
Share this page:
URL copied!